TL;DR: With large enterprises scaling agents across Claude and other agentic tooling, leaders struggle to consolidate telemetry and understand how agents are being used and the cost of agentic task execution. This article explores why traditional API-based reporting is insufficient and how an OpenTelemetry-powered architecture enables organisations to capture richer operational insights across agentic usage.
In our work at a large retail organisation, the client team worked with agentic tooling from multiple vendors in a multi-cloud environment. Traditional API telemetry exposed only a subset of the signals needed to govern the dozens of AI agents used daily.
Business owners had limited visibility into how team members were working with agents, creating several operational challenges. They could not determine
Which agentic skills were most useful and worth improving.
Which agents were delivering the greatest value.
Which workflows were driving unnecessary token consumption
Why some agent-driven tasks were slower, more expensive, or produced inconsistent outcomes.
When failures occurred, there was no clear record of the decisions an agent had made, the tools it had called, or the sequence of actions that led to the issue. This made compliance and auditing complicated and limited agentic potential across several key domains.
V2 implemented an observability layer built on OpenTelemetry, expanding visibility across multiple agentic platforms. We created a single source of truth for human-agent activity, enabling business leaders to attribute costs to specific workflows.
This helped with overall ROI analysis and understanding exactly where AI is driving business value. The client could also establish the governance required to confidently scale AI agents across the enterprise.
Understanding OpenTelemetry in the Context of AI
OpenTelemetry is a vendor and tool agnostic observability framework designed to facilitate the generation and collection of telemetry, the operational data generated by a system as it runs, such as requests, execution paths, performance, resource utilisation, errors, and interactions with existing systems. It provides the visibility needed to understand how AI agents operate, the decisions they make, and why they behave as they do.
Before diving in, let's briefly review terminology. An AI agent is an intelligent application that performs specific tasks autonomously. In contrast, an AI agent framework is the platform used to build, orchestrate and deploy AI agents at scale.
As organisations scale AI agents across engineering teams, different vendors and tooling may be introduced organically as best-fit choices for different requirements. Different agent frameworks expose their own dashboards and reporting capabilities, creating an inconsistent view of how AI is being used across the enterprise.
OpenTelemetry (OTel) addresses this challenge by creating a common observability layer spanning the entire AI ecosystem. It establishes common semantic conventions, enabling teams to collect comparable telemetry across heterogeneous AI environments.
Benefits of Introducing OpenTelemetry
OpenTelemetry helps compare operational behaviour across AI ecosystems using a common language. Organisations can use it to answer business questions around impact, cost and governance.
Unified Visibility
OpenTelemetry standardises and aggregates telemetry across multiple environments, providing a consolidated view of AI adoption, utilisation and performance.
Richer Operational Insights
Vendors typically expose only a subset of available telemetry. OpenTelemetry captures additional signals directly from agent execution, including workflow paths, execution traces and agent capabilities that may not be available through provider APIs. For example, agent skill usage is not currently exposed via the OpenAI (Codex) API, but it is available via OpenTelemetry.
Flexible Integration
Once telemetry is collected, teams export the data to multiple destinations simultaneously and can easily integrate AI observability into their existing governance and reporting ecosystems.
Cost Optimisation
OpenTelemetry correlates execution paths, model selection, retries and tool usage with cost and latency. Organisations can identify and optimise inefficient workflows across providers rather than just within individual platforms.
Lower Cost of Observability
Because OpenTelemetry is an open standard, organisations can collect and process telemetry without relying exclusively on vendor-specific monitoring services. This reduces dependency on paid API-based reporting while providing greater control over telemetry management.
Getting Started with OpenTelemetry
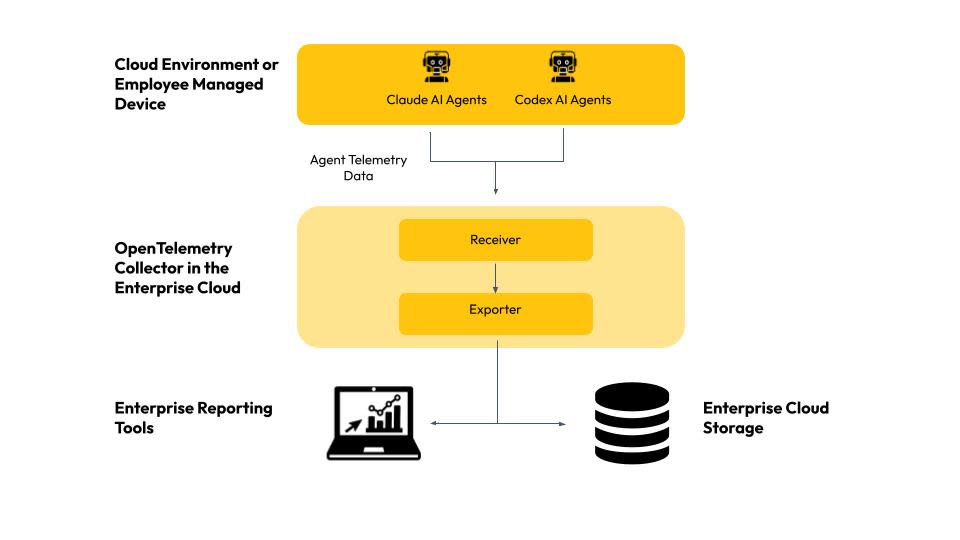
For OpenTelemetry to collect observability data, AI applications and frameworks must be instrumented. There are two primary approaches.
Baked-in instrumentation - The AI framework already emits telemetry using OpenTelemetry semantic conventions as part of its native functionality and requires minimal configuration.
OpenTelemetry instrumentation: Developers import OpenTelemetry libraries that emit telemetry in accordance with OpenTelemetry standards.
Once instrumentation is in place, telemetry is sent to an OpenTelemetry Collector. Acting as the central hub of the observability pipeline, the Collector:
Receives telemetry from AI agents
Processes and enriches it where required
Routes it to one or more downstream systems.
Exporters for Downstream Integration
This is where the exporter comes in. In OpenTelemetry, an exporter is the last stage of a telemetry pipeline. It translates the Collector's internal data model into the format necessary for your reporting tools. For example, a Jaeger exporter speaks the Jaeger protocol, and a Prometheus exporter knows how to communicate with Prometheus.
As exporters are decoupled from collection, a single pipeline can fan out to multiple exporters at once, without requiring changes to agent instrumentation. This is what makes OpenTelemetry so flexible for any enterprise environment.
Building Custom Exporters
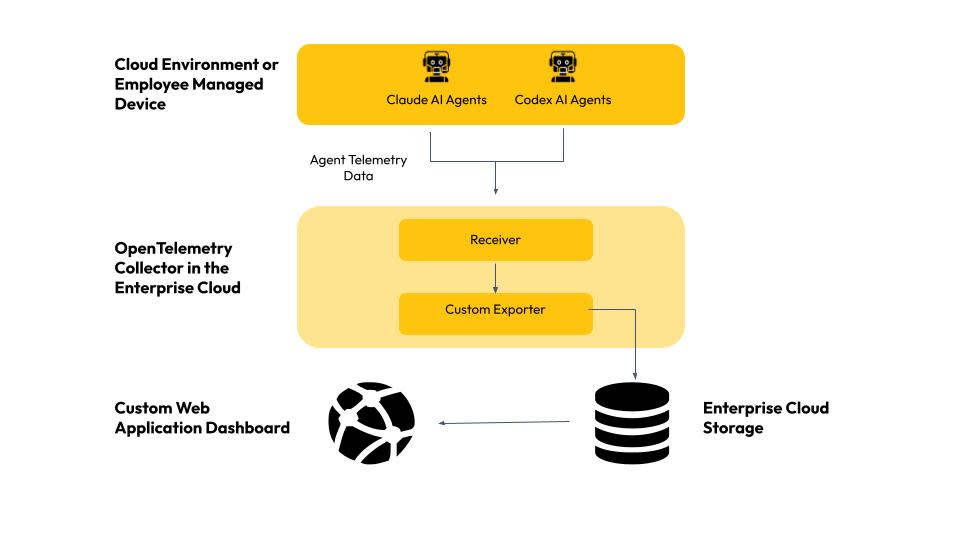
The OpenTelemetry registry includes several hundred built-in exporters to cover common use cases. However, they may not be suitable for enterprise-scale agent governance for the following reasons:
Coverage gaps - Many exporters are still maturing, and agent metrics support may lag behind what your team needs to measure.
Efficiency gaps- Generic exporters may not share data in the most cost-efficient way, making the telemetry analytics process unnecessarily expensive. For example, they may unnecessarily chunk information, adding to storage costs or fail to support how data will actually be queried downstream.
We built a custom exporter for our client because it lets them make their own trade-off between the metrics they need and the optimal data formats and processes that work best in their environment. The client had a custom Web application dashboard; hence, the custom exporter routed telemetry data to cloud storage first, then to the Web application. The custom exporter also catered for downstream analytics efficiency through optimal data partitioning, file sizing and other optimisations.
Final Words
Collecting telemetry is only the first step. The greatest value comes from continuously mapping operational data to business objectives. It links the what and why of agentic behaviour with the business value chain, enabling leaders to identify where AI adds the most value and further optimise to maximise AI ROI.
Organisations that establish this observability foundation early are better positioned to continuously improve the value AI delivers across the enterprise.